Recology has moved to Github, using Jekyll.
I just finished moving the Recology blog content, etc. to Github. This move is intended to make it easy to do exactly what I want with this blog without the constrictions of Blogger. Thanks for continuing to come back and read. I won't delete the Blogger version of this blog, but only new content will appear on the new site.
I haven't figured out how to get the RSS working yet, but I'm working on it.
Showing posts with label R. Show all posts
Showing posts with label R. Show all posts
Friday, January 6, 2012

Thursday, December 29, 2011
Weecology can has new mammal dataset
Recology has moved - go to http://recology.info/2011/12/weecology-can-has-new-mammal-dataset
So the Weecology folks have published a large dataset on mammal communities in a data paper in Ecology. I know nothing about mammal communities, but that doesn't mean one can't play with the data...
Their dataset consists of five csv files: communities, references, sites, species, and trapping data.
Where are these sites, and by the way, do they vary much in altitude?

Let's zoom in on just 'the states'?

What phylogenies can we get for the species in this dataset?
We can use the rOpenSci package treebase to search the online phylogeny repository TreeBASE. Limiting to returning a max of 1 tree (to save time), we can see that X species are in at least 1 tree on the TreeBASE database. Nice.
So there are 321 species in the database with at least 1 tree in the TreeBASE database. Of course there could be many more, but we limited results from TreeBASE to just 1 tree per query.
Here's the code:
So the Weecology folks have published a large dataset on mammal communities in a data paper in Ecology. I know nothing about mammal communities, but that doesn't mean one can't play with the data...
Their dataset consists of five csv files: communities, references, sites, species, and trapping data.
Where are these sites, and by the way, do they vary much in altitude?

Let's zoom in on just 'the states'?

What phylogenies can we get for the species in this dataset?
We can use the rOpenSci package treebase to search the online phylogeny repository TreeBASE. Limiting to returning a max of 1 tree (to save time), we can see that X species are in at least 1 tree on the TreeBASE database. Nice.
So there are 321 species in the database with at least 1 tree in the TreeBASE database. Of course there could be many more, but we limited results from TreeBASE to just 1 tree per query.
Here's the code:
Friday, December 23, 2011
Recology is 1 yr old...
Recology has moved, go to http://recology.info/2011/12/recology-is-1-yr-old
This blog has lasted a whole year already. Thanks for reading and commenting.
There are a couple of announcements:
Anywho, here is the breakdown of visits to this blog, visualized using #ggplot2, of course. There were a total of about 23,000 pageviews in the first year of this blog. Here is the pie chart code I used:
Visits to top ten posts:

Visits by by pages:

Visits by top referring sites:

Visits by country:

Visits by browsers:

Visits by operating system:

This blog has lasted a whole year already. Thanks for reading and commenting.
There are a couple of announcements:
- Less blogging: I hope to put in many more years blogging here, but in full disclosure, I am blogging for Journal of Ecology now, so I am going to be (and already have been) blogging less here.
- More blogging: If anyone wants to write guest posts at Recology on the topics of using R for ecology and evolution, or open science, please contact me!
- Different blogging: I was going to roll out the new dynamic views for this blog, but Google doesn't allow javascript, which is how I include code using GitHub gists. Oh well...
Anywho, here is the breakdown of visits to this blog, visualized using #ggplot2, of course. There were a total of about 23,000 pageviews in the first year of this blog. Here is the pie chart code I used:
Visits to top ten posts:

Visits by by pages:

Visits by top referring sites:

Visits by country:

Visits by browsers:

Visits by operating system:

Tuesday, December 13, 2011
I Work For The Internet !
Recology has moved, go to http://recology.info/2011/12/i-work-for-internet
UPDATE: code and figure updated at 647 AM CST on 19 Dec '11. Also, see Jarrett Byrnes (improved) fork of my gist here.
The site I WORK FOR THE INTERNET is collecting pictures and first names (last name initials only) to show collective support against SOPA (the Stop Online Piracy Act). Please stop by their site and add your name/picture.
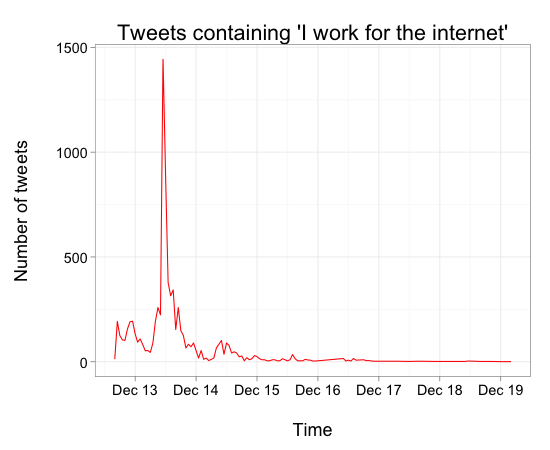
I used the #rstats package twitteR, created by Jeff Gentry, to search for tweets from people signing this site with their picture, then plotted using ggplot2, and also used Hadley's lubridate to round timestamps on tweets to be able to bin tweets in to time slots for plotting.
Tweets containing the phrase 'I work for the internet' by time:

UPDATE: code and figure updated at 647 AM CST on 19 Dec '11. Also, see Jarrett Byrnes (improved) fork of my gist here.
The site I WORK FOR THE INTERNET is collecting pictures and first names (last name initials only) to show collective support against SOPA (the Stop Online Piracy Act). Please stop by their site and add your name/picture.
I used the #rstats package twitteR, created by Jeff Gentry, to search for tweets from people signing this site with their picture, then plotted using ggplot2, and also used Hadley's lubridate to round timestamps on tweets to be able to bin tweets in to time slots for plotting.
Tweets containing the phrase 'I work for the internet' by time:
Here's the code as a GitHub gist. Sometimes the searchTwitter fxn doesn't returns an error, which I don't understand, but you can play with it:
Wednesday, November 30, 2011
rOpenSci won 3rd place in the PLoS-Mendeley Binary Battle!
Recology has moved go to http://recology.info/2011/11/ropensci-won-3rd-place-in-plos-mendeley
I am part of the rOpenSci development team (along with Carl Boettiger, Karthik Ram, and Nick Fabina). Our website: http://ropensci.org/. Code at Github: https://github.com/ropensci
We entered two of our R packages for integrating with PLoS Journals (rplos) and Mendeley (RMendeley) in the Mendeley-PLoS Binary Battle. Get them at GitHub (rplos; RMendeley).
These two packages allow users (from R! of course) to search and retrieve data from PLoS journals (including their altmetrics data), and from Mendeley. You could surely mash up data from both PLoS and Mendeley. That's what's cool about rOpenSci - we provide the tools, and leave it up to users vast creativity to do awesome things.
3rd place gives us a $1,000 prize, plus a Parrot AR Drone helicopter.
Friday, November 18, 2011
My talk on doing phylogenetics in R
Recology has moved, go to http://recology.info/2011/11/my-talk-on-doing-phylogenetics-in-r
I gave a talk today on doing very basic phylogenetics in R, including getting sequence data, aligning sequence data, plotting trees, doing trait evolution stuff, etc.
Please comment if you have code for doing bayesian phylogenetic inference in R. I know phyloch has function mrbayes, but can't get it to work...
I gave a talk today on doing very basic phylogenetics in R, including getting sequence data, aligning sequence data, plotting trees, doing trait evolution stuff, etc.
Please comment if you have code for doing bayesian phylogenetic inference in R. I know phyloch has function mrbayes, but can't get it to work...
Friday, October 28, 2011
My little presentation on getting web data through R
Recology has moved, go to http://recology.info/my-little-presentation-on-getting-web
With examples from rOpenSci R packages. p.s. I am no expert at this...
Web data from R
With examples from rOpenSci R packages. p.s. I am no expert at this...
Web data from R
View more presentations from schamber
Thursday, October 27, 2011
Two new rOpenSci R packages are on CRAN
Recology has moved, go to http://recology.info/2011/10/two-new-ropensci-r-packages-are-on-cran
Carl Boettiger, a graduate student at UC Davis, just got two packages on CRAN. One is treebase, which which handshakes with the Treebase API. The other is rfishbase, which connects with the Fishbase, although I believe just scrapes XML content as there is no API. See development on GitHub for treebase here, and for rfishbase here. Carl has some tutorials on treebase and rfishbase at his website here, and we have an official rOpenSci tutorial for treebase here.
Basically, these two R packages let you search and pull down data from Treebase and Fishbase - pretty awesome. This improves workflow, and puts your data search and acquisition component into your code, instead of being a bunch of mouse clicks in a browser.
These two packages are part of the rOpenSci project.
Carl Boettiger, a graduate student at UC Davis, just got two packages on CRAN. One is treebase, which which handshakes with the Treebase API. The other is rfishbase, which connects with the Fishbase, although I believe just scrapes XML content as there is no API. See development on GitHub for treebase here, and for rfishbase here. Carl has some tutorials on treebase and rfishbase at his website here, and we have an official rOpenSci tutorial for treebase here.
Basically, these two R packages let you search and pull down data from Treebase and Fishbase - pretty awesome. This improves workflow, and puts your data search and acquisition component into your code, instead of being a bunch of mouse clicks in a browser.
These two packages are part of the rOpenSci project.
Wednesday, October 26, 2011
Two-sex demographic models in R
Recology has moved, go to http://recology.info/2011/10/two-sex-demographic-models-in-r
Tom Miller (a prof here at Rice) and Brian Inouye have a paper out in Ecology (paper, appendices) that confronts two-sex models of dispersal with empirical data.
They conducted the first confrontation of two-sex demographic models with empirical data on lab populations of bean beetles Callosobruchus.
Their R code for the modeling work is available at Ecological Archives (link here).
Here is a figure made from running the five blocks of code in 'Miller_and_Inouye_figures.txt' that reproduces Fig. 4 (A-E) in their Ecology paper (p = proportion female, Nt = density). Nice!
A: Saturating density dependence
B: Over-compensatory density dependence
C: Sex-specific gamma's (but bM=bF=0.5)
D: Sex-specific b's (but gammaM=gammaF=1)
E: Sex-specific b's (but gammaM=gammaF=2)

Tom Miller (a prof here at Rice) and Brian Inouye have a paper out in Ecology (paper, appendices) that confronts two-sex models of dispersal with empirical data.
They conducted the first confrontation of two-sex demographic models with empirical data on lab populations of bean beetles Callosobruchus.
Their R code for the modeling work is available at Ecological Archives (link here).
Here is a figure made from running the five blocks of code in 'Miller_and_Inouye_figures.txt' that reproduces Fig. 4 (A-E) in their Ecology paper (p = proportion female, Nt = density). Nice!
A: Saturating density dependence
B: Over-compensatory density dependence
C: Sex-specific gamma's (but bM=bF=0.5)
D: Sex-specific b's (but gammaM=gammaF=1)
E: Sex-specific b's (but gammaM=gammaF=2)

Friday, October 14, 2011
New food web dataset
Recology has moved, go to http://recology.info/2011/10/new-food-web-dataset
So, there is a new food web dataset out that was put in Ecological Archives here, and I thought I would play with it. The food web is from Otago Harbour, an intertidal mudflat ecosystem in New Zealand. The web contains 180 nodes, with 1,924 links.
Fun stuff...

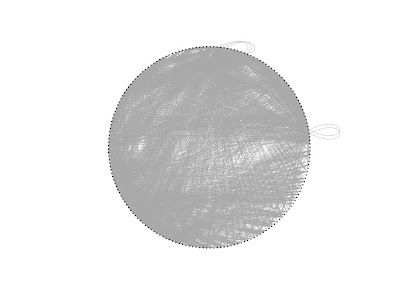
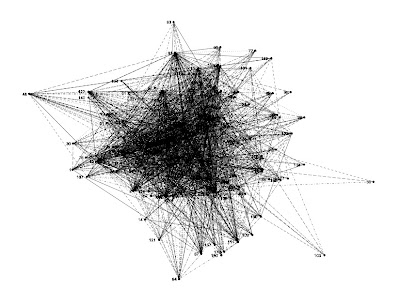
So, there is a new food web dataset out that was put in Ecological Archives here, and I thought I would play with it. The food web is from Otago Harbour, an intertidal mudflat ecosystem in New Zealand. The web contains 180 nodes, with 1,924 links.
Fun stuff...
igraph, default layout plot

igraph, circle layout plot, nice

My funky little gggraph function plot
get the gggraph function, and make it better, here at Github

Thursday, October 13, 2011
Phylogenetic community structure: PGLMMs
Recology has moved, go to http://recology.info/2011/10/phylogenetic-community-structure-pglmms
So, I've blogged about this topic before, way back on 5 Jan this year.
Matt Helmus, a postdoc in the Wootton lab at the University of Chicago, published a paper with Anthony Ives in Ecological Monographs this year (abstract here). The paper addressed a new statistical approach to phylogenetic community structure.
As I said in the original post, part of the power of the PGLMM (phylogenetic generalized linear mixed models) approach is that you don't have to conduct quite so many separate statistical tests as with the previous null model/randomization approach.
Their original code was written in Matlab. Here I provide the R code that Matt has so graciously shared with me. There are four functions and a fifth file has an example use case. The example and output are shown below.
Look for the inclusion of Matt's PGLMM to the picante R package in the future.
Here are links to the files as GitHub gists:
PGLMM.data.R: https://gist.github.com/1278205
PGLMM.fit.R: https://gist.github.com/1284284
PGLMM.reml.R: https://gist.github.com/1284287
PGLMM.sim.R: https://gist.github.com/1284288
PGLMM_example.R: https://gist.github.com/1284442
Enjoy!
The example
..and the figures...


So, I've blogged about this topic before, way back on 5 Jan this year.
Matt Helmus, a postdoc in the Wootton lab at the University of Chicago, published a paper with Anthony Ives in Ecological Monographs this year (abstract here). The paper addressed a new statistical approach to phylogenetic community structure.
As I said in the original post, part of the power of the PGLMM (phylogenetic generalized linear mixed models) approach is that you don't have to conduct quite so many separate statistical tests as with the previous null model/randomization approach.
Their original code was written in Matlab. Here I provide the R code that Matt has so graciously shared with me. There are four functions and a fifth file has an example use case. The example and output are shown below.
Look for the inclusion of Matt's PGLMM to the picante R package in the future.
Here are links to the files as GitHub gists:
PGLMM.data.R: https://gist.github.com/1278205
PGLMM.fit.R: https://gist.github.com/1284284
PGLMM.reml.R: https://gist.github.com/1284287
PGLMM.sim.R: https://gist.github.com/1284288
PGLMM_example.R: https://gist.github.com/1284442
Enjoy!
The example
..and the figures...


Thursday, October 6, 2011
R talk on regular expressions (regex)
Recology has moved, go to http://recology.info/2011/10/r-talk-on-regular-expressions-regex
Regular expressions are a powerful in any language to manipulate, search, etc. data.
For example:
R base has many functions for regular expressions, see slide 9 of Ed's talk below. The package stringr, created by Hadley Wickham, is a nice alternative that wraps the base regex functions for easier use. I highly recommend stringr.
Ed Goodwin, the coordinator of the Houston R Users group, gave a presentation to the group last night on regular expressions in R. It was a great talk, and he is allowing me to post his talk here.
Enjoy! And thanks for sharing Ed!
Regular expressions are a powerful in any language to manipulate, search, etc. data.
For example:
R base has many functions for regular expressions, see slide 9 of Ed's talk below. The package stringr, created by Hadley Wickham, is a nice alternative that wraps the base regex functions for easier use. I highly recommend stringr.
Ed Goodwin, the coordinator of the Houston R Users group, gave a presentation to the group last night on regular expressions in R. It was a great talk, and he is allowing me to post his talk here.
Enjoy! And thanks for sharing Ed!
Friday, September 30, 2011
R tutorial on visualizations/graphics
Recology has moved, go to http://recology.info/2011/09/r-tutorial-on-visualizationsgraphics
Rolf Lohaus, a Huxley postdoctoral fellow here in the EEB dept at Rice University, gave our R course a talk on basic visualizations in R this morning.
Enjoy!
Rolf Lohaus, a Huxley postdoctoral fellow here in the EEB dept at Rice University, gave our R course a talk on basic visualizations in R this morning.
Enjoy!
Friday, September 9, 2011
My take on an R introduction talk
Recology has moved, go to http://recology.info/2011/09/my-take-on-r-introduction-talk
UPDATE: I put in an R tutorial as a Github gist below.
Here is a short intro R talk I gave today...for what it's worth...
UPDATE: I put in an R tutorial as a Github gist below.
Here is a short intro R talk I gave today...for what it's worth...
Wednesday, August 31, 2011
rnpn: An R interface for the National Phenology Network
Recology has moved, go to http://recology.info/2011/08/rnpn-r-interface-for-national-phenology
The team at rOpenSci and I have been working on a wrapper for the USA National Phenology Network API. The following is a demo of some of the current possibilities. We will have more functions down the road. Get the publicly available code, and contribute, at Github here. If you try this out look at the Description file for the required R packages to run rnpn. Let us know at Github (here) or at our website http://ropensci.org/, or in the comments below, or on twitter (@rOpenSci), what use cases you would like to see with the rnpn package.
Method and demo of each:
Get observations for species by day
From the documentation: "This function will return a list of species, containing all the dates which observations were made about the species, and a count of the number of such observations made on that date."
#### Note, the data below is truncated for blogging brevity...
Get individuals at specific stations
From the documentation: "This function returns all of the individuals at a series of stations."
Get individuals of species at stations
From the documentation: "This function will return a list of all the individuals, which are members of a species, among any number of stations."
Get observation associated with particular observation
From the documentation: "This function will return the comment associated with a particular observation."
> getobscomm(1938) # The observation for observation number 1938
The team at rOpenSci and I have been working on a wrapper for the USA National Phenology Network API. The following is a demo of some of the current possibilities. We will have more functions down the road. Get the publicly available code, and contribute, at Github here. If you try this out look at the Description file for the required R packages to run rnpn. Let us know at Github (here) or at our website http://ropensci.org/, or in the comments below, or on twitter (@rOpenSci), what use cases you would like to see with the rnpn package.
Method and demo of each:
Get observations for species by day
From the documentation: "This function will return a list of species, containing all the dates which observations were made about the species, and a count of the number of such observations made on that date."
#### Note, the data below is truncated for blogging brevity...
> getobsspbyday(c(1, 2), '2008-01-01', '2011-12-31') # Searched for species 1 and 2 from Jan 1, 2008 to Dec 31, 2011
          date count   species
1   2009-03-08     2 species 1
2   2009-03-15     1 species 1
3   2009-03-22     1 species 1
4   2009-03-24     1 species 1
5   2009-03-26     1 species 1
6   2009-04-17     1 species 1
7   2009-04-24     1 species 1
8   2009-05-12     1 species 1
9   2009-05-20     1 species 1
10  2009-11-24     1 species 1
11  2009-12-07     1 species 1
12  2010-01-18     1 species 1
13  2010-01-23     1 species 1
62  2011-05-29     1 species 1
63  2011-06-27     1 species 1
64  2011-06-30     2 species 1
65  2009-03-17     1 species 2
66  2009-04-03     3 species 2
67  2009-04-05     3 species 2
68  2009-04-10     3 species 2
69  2009-04-17     3 species 2
Get individuals at specific stations
From the documentation: "This function returns all of the individuals at a series of stations."
> getindsatstations(c(507, 523)) # Searched for any individuals at stations 507 and 523
   individual_id individual_name species_id kingdom
1           1200         dogwood         12 Plantae
2           1197    purple lilac         36 Plantae
3           1193         white t         38 Plantae
4           3569     forsythia-1         73 Plantae
5           1206            jack        150 Plantae
6           1199      trout lily        161 Plantae
7           1198           dandy        189 Plantae
8           1192           red t        192 Plantae
9           1710    common lilac         36 Plantae
10          1711  common lilac 2         36 Plantae
11          1712       dandelion        189 Plantae
Get individuals of species at stations
From the documentation: "This function will return a list of all the individuals, which are members of a species, among any number of stations."
> getindspatstations(35, c(60, 259), 2009)  # Search for individuals of species 35 at stations 60 and 259 in year 2009
  individual_id individual_name number_observations
1          1715            west                   5
2          1716            east                   5
Get observation associated with particular observation
From the documentation: "This function will return the comment associated with a particular observation."
> getobscomm(1938) # The observation for observation number 1938
$observation_comment
[1] "some lower branches are bare"
Monday, August 22, 2011
Tenure track position in systematics at the University of Vermont
Recology has moved, go to http://recology.info/2011/08/tenure-track-position-in-systematics-at
There is an awesome position opening up for an assistant professor in systematics at the University of Vermont. Below is the announcement, and see the original post at the Distributed Ecology blog. Why is this related to R? One can do a lot of systematics work in R, including retrieving scientific collections data through an upcoming package handshaking with VertNet (part of the rOpenSci project), managing large data sets, retrieval of GenBank data through the ape package (see fxn read.genbank), phylogenetic reconstruction and analysis, and more. So I am sure a systematist with R ninja skills will surely have a head up on the rest of the field.
Assistant Professor in Systematics
Department of Biology
University of Vermont
Burlington, Vermont
The Department of Biology of the University of Vermont seeks applications for a tenure- track Assistant Professor position in Systematics and Evolutionary Biology of arthropods, especially insects. The position will be open in the fall of 2012. The successful candidate will have expertise in classical and molecular systematics, including analysis of complex data sets. Candidates pursuing phylogenomics and innovative methods in bioinformatics in combination with taxonomy are especially encouraged to apply. Department information at: http://www.uvm.edu/~biology/.
All applicants are expected to: 1) hold a Ph.D. degree in relevant disciplines and have two or more years of postdoctoral experience; 2) develop a competitively funded research program; 3) teach undergraduate courses (chosen from among general biology, evolution, systematic entomology, and others in the candidate's expertise); 4) teach, mentor and advise undergraduate and graduate students; and 5) oversee a natural history collection of historic significance.
Candidates must apply online: http://www.uvmjobs.com/. On left see "Search Postings" then find "Biology" under "HCM Department" then posting 0040090 (first posting). Sorry, but we cannot supply the direct link because it will time out.
Attach a cover letter with a statement of research focus and teaching interests (one document), a curriculum vitae, representative publications, and the contact information of three references.
Review of applications will begin on September 15, 2011, and will continue until the position is filled. Questions and up to three additional publications may be directed to Dr. Jos. J. Schall: jschall@uvm.edu.
The University of Vermont recently identified several "Spires of Excellence" in which it will strategically focus institutional investments and growth over the next several years. One spire associated with the position is Complex Systems. Candidates whose research interests align with this spire are especially encouraged to applyhttp://www.uvm.edu/~tri/.
The University seeks faculty who can contribute to the diversity and excellence of the academic community through their research, teaching, and/or service. Applicants are requested to include in their cover letter information about how they will further this goal. The University of Vermont is an Affirmative Action/Equal Opportunity employer. The Department is committed to increasing faculty diversity and welcomes applications from women, underrepresented ethnic, racial and cultural groups, and from people with disabilities.
Department of Biology
University of Vermont
Burlington, Vermont
The Department of Biology of the University of Vermont seeks applications for a tenure- track Assistant Professor position in Systematics and Evolutionary Biology of arthropods, especially insects. The position will be open in the fall of 2012. The successful candidate will have expertise in classical and molecular systematics, including analysis of complex data sets. Candidates pursuing phylogenomics and innovative methods in bioinformatics in combination with taxonomy are especially encouraged to apply. Department information at: http://www.uvm.edu/~biology/.
All applicants are expected to: 1) hold a Ph.D. degree in relevant disciplines and have two or more years of postdoctoral experience; 2) develop a competitively funded research program; 3) teach undergraduate courses (chosen from among general biology, evolution, systematic entomology, and others in the candidate's expertise); 4) teach, mentor and advise undergraduate and graduate students; and 5) oversee a natural history collection of historic significance.
Candidates must apply online: http://www.uvmjobs.com/. On left see "Search Postings" then find "Biology" under "HCM Department" then posting 0040090 (first posting). Sorry, but we cannot supply the direct link because it will time out.
Attach a cover letter with a statement of research focus and teaching interests (one document), a curriculum vitae, representative publications, and the contact information of three references.
Review of applications will begin on September 15, 2011, and will continue until the position is filled. Questions and up to three additional publications may be directed to Dr. Jos. J. Schall: jschall@uvm.edu.
The University of Vermont recently identified several "Spires of Excellence" in which it will strategically focus institutional investments and growth over the next several years. One spire associated with the position is Complex Systems. Candidates whose research interests align with this spire are especially encouraged to applyhttp://www.uvm.edu/~tri/.
The University seeks faculty who can contribute to the diversity and excellence of the academic community through their research, teaching, and/or service. Applicants are requested to include in their cover letter information about how they will further this goal. The University of Vermont is an Affirmative Action/Equal Opportunity employer. The Department is committed to increasing faculty diversity and welcomes applications from women, underrepresented ethnic, racial and cultural groups, and from people with disabilities.
Monday, August 8, 2011
(#ESA11) rOpenSci: a collaborative effort to develop R-based tools for facilitating Open Science
Recology has moved, go to http://recology.info/2011/08/esa11-ropensci-collaborative-effort-to_08
Our development team would like to announce the launch of rOpenSci. As the title states, this project aims to create R packages to make open science more available to researchers.
What this means is that we seek to connect researchers using R with as much open data as possible, mainly through APIs. There are a number of R packages that already do this (e.g., infochimps, twitteR), but we are making more packages, e.g., for Mendeley, PLoS Journals, and taxonomic sources (ITIS, EOL, TNRS, Phylomatic, UBio).
Importantly, we are creating a package called rOpenSci, which aims to integrate functions from packages for individual open data sources.
If you are somewhat interested, follow our progress on our website, on Twitter, or contact us. If you are really^2 interested you could go to Github and contribute. If you are really^3 interested, join our development team.
Our development team would like to announce the launch of rOpenSci. As the title states, this project aims to create R packages to make open science more available to researchers.
 |
| http://ropensci.org/ |
What this means is that we seek to connect researchers using R with as much open data as possible, mainly through APIs. There are a number of R packages that already do this (e.g., infochimps, twitteR), but we are making more packages, e.g., for Mendeley, PLoS Journals, and taxonomic sources (ITIS, EOL, TNRS, Phylomatic, UBio).
Importantly, we are creating a package called rOpenSci, which aims to integrate functions from packages for individual open data sources.
If you are somewhat interested, follow our progress on our website, on Twitter, or contact us. If you are really^2 interested you could go to Github and contribute. If you are really^3 interested, join our development team.
Thursday, July 14, 2011
CRdata vs. Cloudnumbers
Cloudnumbers and CRdata are two new cloud computing services.
I tested the two services with a very simple script. The script simply creates a dataframe of 10000 numbers via rnorm, and assigns them to a factor of one of two levels (a or b). I then take the mean of the two factor levels with the aggregate function.
In CRdata you need to put in some extra code to format the output in a browser window. For example, the last line below needs to have '<crdata_object>' on both sides of the output object so it can be rendered in a browser. And etc. for other things that one would print to a console. Whereas you don't need this extra code for using Cloudnumbers.
Here is a screenshot of the output from CRdata with the simple script above.

This simple script ran in about 20 seconds or so from starting the job to finishing. However, it seems like the only output option is html. Can this be right? This seems like a terrible only option.
In Cloudnumbers you have to start a workspace, upload your R code file.
Then, start a session...
choose your software platform...
choose packages (one at a time, very slow)...
then choose number of clusters, etc.
Then finally star the job.
Then it initializes, then finally you can open the console, and
Then from here it is like running R as you normally would, except on the web.
Who wins (at least for our very minimal example above)
I tested the two services with a very simple script. The script simply creates a dataframe of 10000 numbers via rnorm, and assigns them to a factor of one of two levels (a or b). I then take the mean of the two factor levels with the aggregate function.
In CRdata you need to put in some extra code to format the output in a browser window. For example, the last line below needs to have '<crdata_object>' on both sides of the output object so it can be rendered in a browser. And etc. for other things that one would print to a console. Whereas you don't need this extra code for using Cloudnumbers.
Here is a screenshot of the output from CRdata with the simple script above.
This simple script ran in about 20 seconds or so from starting the job to finishing. However, it seems like the only output option is html. Can this be right? This seems like a terrible only option.
In Cloudnumbers you have to start a workspace, upload your R code file.
Then, start a session...
choose your software platform...
choose packages (one at a time, very slow)...
then choose number of clusters, etc.
Then finally star the job.
Then it initializes, then finally you can open the console, and
Then from here it is like running R as you normally would, except on the web.
Who wins (at least for our very minimal example above)
- Speed of entire process (not just running code): CRdata
- Ease of use: CRdata
- Cost: CRdata (free only)
- Least annoying: Cloudnumbers (you don't have to add in extra code to run your own code)
- Opensource: CRdata (you can use publicly available code on the site)
- Long-term use: Cloudnumbers (more powerful, flexible, etc.)
I imagine Cloudnumbers could be faster for larger jobs, but you would have to pay for the speed of course.
What I really want to see is a cloud computing service that accepts code directly run from R or RStudio. Hmmm...that would be so tasty indeed. I think Cloudnumbers may be able to do this, but haven't tested it yet.
Perhaps using the server version of RStudio along with Amazon's EC2 is a better option than both of these. See Karthik Ram's post about using RStudio server along with Amazon's EC2. Even just running RStudio server on your Unbuntu machine or virtual machine is a pretty cool option, even without EC2 (works like a charm on my Parallels Ubuntu vm on my Mac).
Tuesday, June 28, 2011
rbold: An R Interface for Bold Systems barcode repository
Have you ever wanted to search and fetch barcode data from Bold Systems?
I am developing functions to interface with Bold from R. I just started, but hopefully folks will find it useful.
The code is at Github here. The two functions are still very buggy, so please bring up issues below, or in the Issues area on Github. For example, some searches work and other similar searches don't. Apologies in advance for the bugs.
Below is a screenshot of an example query using function getsampleids to get barcode identifiers for specimens. You can then use getseqs function to grab barcode data for specific specimens or many specimens.

I am developing functions to interface with Bold from R. I just started, but hopefully folks will find it useful.
The code is at Github here. The two functions are still very buggy, so please bring up issues below, or in the Issues area on Github. For example, some searches work and other similar searches don't. Apologies in advance for the bugs.
Below is a screenshot of an example query using function getsampleids to get barcode identifiers for specimens. You can then use getseqs function to grab barcode data for specific specimens or many specimens.
Wednesday, June 22, 2011
iEvoBio 2011 Synopsis
We just wrapped up the 2011 iEvoBio meeting. It was awesome! If you didn't go this year or last year, definitely think about going next year.
Here is a list of the cool projects that were discussed at the meeting (apologies if I left some out):
- Vistrails: workflow tool, awesome project by Claudio Silva
- Commplish: purpose is to use via API's, not with the web UI
- Phylopic: a database of life-form silouhettes, including an API for remote access, sweet!
- Gloome
- MappingLife: awesome geographic/etc data visualization interace on the web
- SuiteSMA: visualizating multiple alignments
- treeBASE: R interface to treebase, by Carl Boettiger
- VertNet: database for vertebrate natural history collections
- RevBayes: revamp of MrBayes, with GUI, etc.
- Phenoscape Knowledge Base
- Peter Midford lightning talk: talked about matching taxonomic and genetic data
- BiSciCol: biological science collections tracker
- Ontogrator
- TNRS: taxonomic name resolution service
- Barcode of Life data systems, and remote access
- Moorea Biocode Project
- Microbial LTER's data
- BirdVis: interactive bird data visualization (Claudio Silva in collaboration with Cornell Lab of Ornithology)
- Crowdlabs: I think the site is down right now, another project by Claudio Silva
- Phycas: Bayesian phylogenetics, can you just call this from R?
- RIP MrBayes!!!! replaced by RevBayes (see 9 above)
- Slides of presentations will be at Slideshare (not all presentations up yet)
- A birds of a feather group I was involved in proposed an idea (TOL-o-matic) like Phylomatic, but of broader scope, for easy access and submission of trees, and perhaps even social (think just pushing a 'SHARE' button within PAUP, RevBayes, or other phylogenetics software)!
- Synopses of Birds of a Feather discussion groups: http://piratepad.net/iEvoBio11-BoF-reportouts
Subscribe to:
Posts (Atom)