# ggplot network graphics functions
# g = an igraph graph object, any igraph graph object
# vplace = type of vertex placement assignment, one of rnorm, runif, etc.

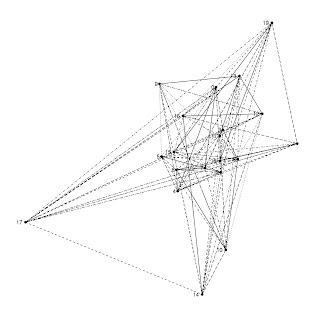
gggraph <- function(g, vplace = rnorm) {

 require(ggplot2)

 g_ <- get.edgelist(g)
 g_df <- as.data.frame(g_)
 g_df$id <- 1:length(g_df[,1])
 g_df <- melt(g_df, id=3)
 xy_s <- data.frame(value = unique(g_df$value),
  x = vplace(length(unique(g_df$value))),
  y = vplace(length(unique(g_df$value))))
 g_df2 <- merge(g_df, xy_s, by = "value")

 p <- ggplot(g_df2, aes(x, y)) +
  geom_point() +
  geom_line(size = 0.3, aes(group = id, linetype = id)) +
  geom_text(size = 3, hjust = 1.5, aes(label = value)) +
  theme_bw() +
  opts(panel.grid.major=theme_blank(),
   panel.grid.minor=theme_blank(),
   axis.text.x=theme_blank(),
   axis.text.y=theme_blank(),
   axis.title.x=theme_blank(),
   axis.title.y=theme_blank(),
   axis.ticks=theme_blank(),
   panel.border=theme_blank(),
   legend.position="none")

 p

}

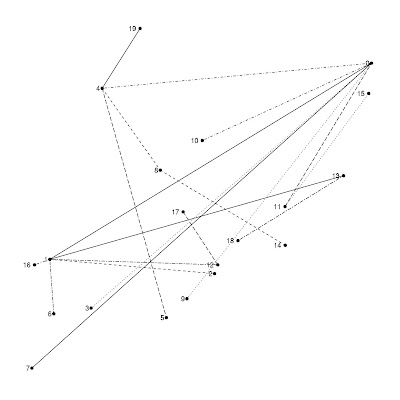
ggbigraph <- function(g) {

 require(ggplot2)

 g_ <- get.edgelist(g)
 g_df <- as.data.frame(g_)
 g_df$id <- 1:length(g_df[,1])
 g_df <- melt(g_df, id=3)
 xy_s <- data.frame(value = unique(g_df$value),
  x = c(rep(2, length(unique(g_df$value))/2), rep(4, length(unique(g_df$value))/2)),
  y = rep(seq(1, length(unique(g_df$value))/2, 1), 2))
 g_df2 <- merge(g_df, xy_s, by = "value")

 p <- ggplot(g_df2, aes(x, y)) +
  geom_point() +
  geom_line(size = 0.3, aes(group = id, linetype = id)) +
  geom_text(size = 3, hjust = 1.5, aes(label = value)) +
  theme_bw() +
  opts(panel.grid.major=theme_blank(),
   panel.grid.minor=theme_blank(),
   axis.text.x=theme_blank(),
   axis.text.y=theme_blank(),
   axis.title.x=theme_blank(),
   axis.title.y=theme_blank(),
   axis.ticks=theme_blank(),
   panel.border=theme_blank(),
   legend.position="none")

 p

}
g <- erdos.renyi.game(20, 5, type="gnm")

# A bipartite graphs
g <- grg.game(20, 0.45, torus=FALSE)
ggbigraph(g)


No comments:
Post a Comment