Showing posts with label igraph. Show all posts

Friday, October 14, 2011

New food web dataset

Recology has moved, go to http://recology.info/2011/10/new-food-web-dataset


So, there is a new food web dataset out that was put in Ecological Archives here, and I thought I would play with it. The food web is from Otago Harbour, an intertidal mudflat ecosystem in New Zealand. The web contains 180 nodes, with 1,924 links.

Fun stuff...

igraph, default layout plot

igraph, circle layout plot, nice

My funky little gggraph function plot
get the gggraph function, and make it better, here at Github


Wednesday, March 23, 2011

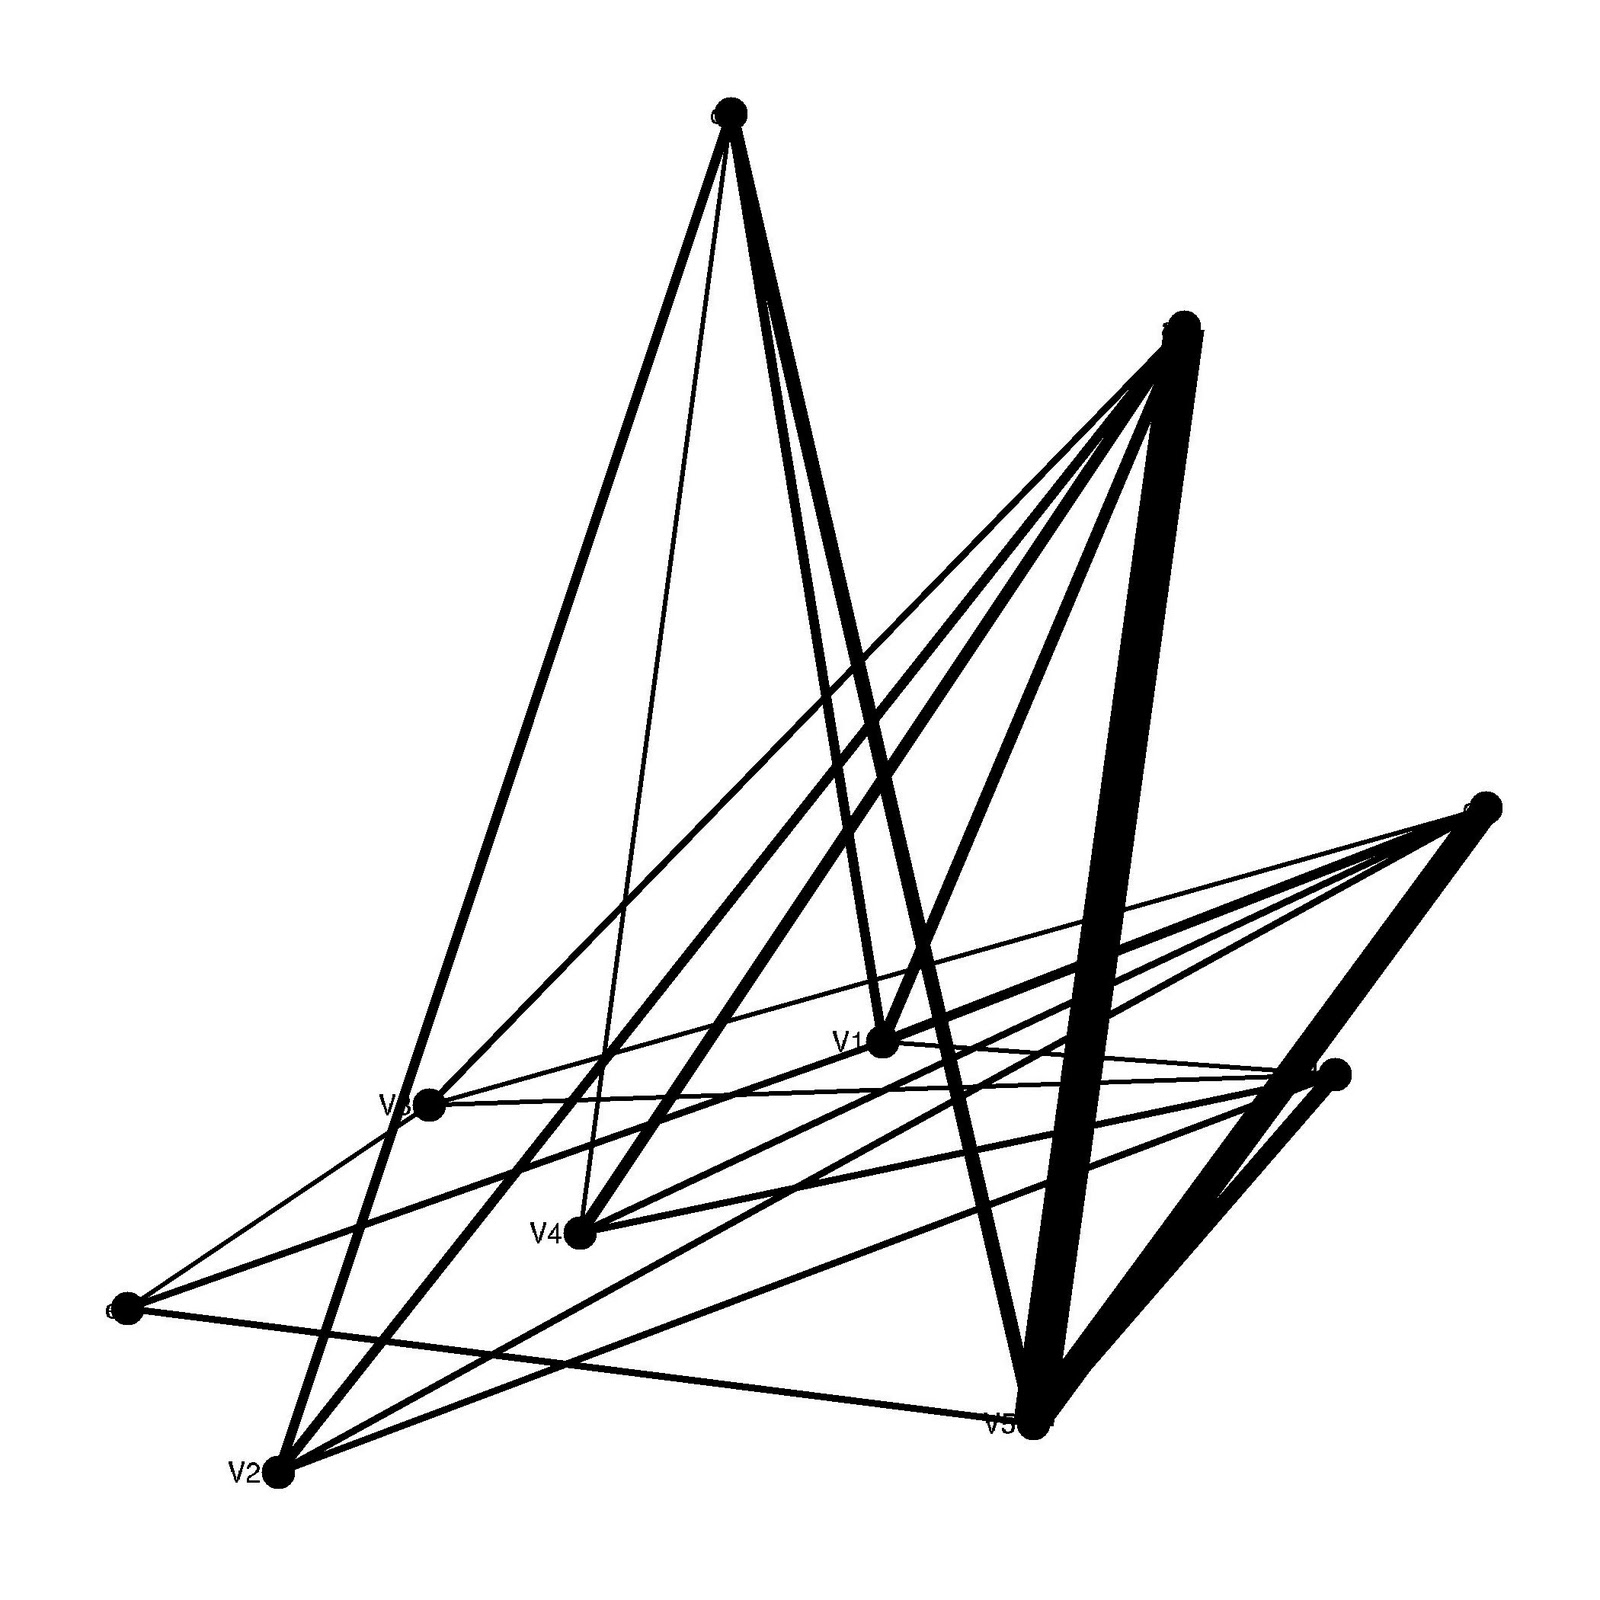
basic ggplot2 network graphs - ver2

I posted last week a simple function to plot networks using ggplot2 package. Here is version 2. I still need to work on figuring out efficient vertex placement.

Changes in version 2:
-You have one of three options: use an igraph object, a matrix, or a dataframe (matrices will be converted to data frames within the function)

-If you have data on food webs similar to that provided in the Takapoto dataset provided in the NetIndices package, you can set trophic = "TRUE", and gggraph will use the function TrophInd to assign trophic levels (the y axis value) to each vertex/node. You have to provide additional information along with this option such as what the imports and exports are, see NetIndices documentation.

-I added some simple error checking.

-if using method="df" and trophic="FALSE", x axis placement of vertices is now done using the function degreex (see inside the fxn), which sorts vertices according to their degree (so the least connected species are on the left of the graph; note that species with the same degree are not stacked on the y-axis because e.g., two vertices of degree=5 would get x=3 then x=4).


######### ggraph version 2
require(bipartite)
require(igraph)
require(ggplot2) 
require(NetIndices)
 
# gggraph, version 2
# g = an igraph graph object, a matrix, or data frame
# vplace = type of vertex placement assignment, one of rnorm, runif, etc.
# method = one of 'df' for data frame, "mat' for matrix or "igraph" for an igraph graph object
# trophic = TRUE or FALSE for using Netindices function TrophInd to determine trophic level (y value in graph)
# trophinames = columns in matrix or dataframe to use for calculating trophic level
# import = named or refereced by col# columns of matrix or dataframe to use for import argument of TrophInd
# export = named or refereced by col# columns of matrix or dataframe to use for export argument of TrophInd
# dead = named or refereced by col# columns of matrix or dataframe to use for dead argument of TrophInd
 
gggraph <- function(g, vplace = rnorm, method, trophic = "FALSE", 
     trophinames, import, export) 
{
degreex  <- function(x) {
  degreecol <- apply(x, 2, function(y) length(y[y>0]))
  degreerow <- apply(x, 1, function(y) length(y[y>0]))
  degrees <- sort(c(degreecol, degreerow))
  df <- data.frame(degrees, x = seq(1, length(degrees), 1))
  df$value <- rownames(df)
  df
 }
  # require igraph
 if(!require(igraph)) stop("must first install 'igraph' package.") 
   # require ggplot2
 if(!require(ggplot2)) stop("must first install 'ggplot2' package.")
 
if(method=="df"){
  if(class(g)=="matrix"){ g <- as.data.frame(g) }
  if(class(g)!="data.frame") stop("object must be of class 'data.frame.'")
if(trophic=="FALSE"){
 # data preparation from adjacency matrix
 temp <- data.frame(expand.grid(dimnames(g))[1:2], as.vector(as.matrix(g)))
 temp <- temp[(temp[, 3] > 0) & !is.na(temp[, 3]), ]
 temp <- temp[sort.list(temp[, 1]), ]
 g_df <- data.frame(rows = temp[, 1], cols = temp[, 2], freqint = temp[, 3])
 
 g_df$id <- 1:length(g_df[,1])
 g_df <- data.frame(id=g_df[,4], rows=g_df[,1], cols=g_df[,2], freqint=g_df[,3])
 g_df_ <- melt(g_df, id=c(1,4))
 
 xy_s <- data.frame(degreex(g), y = rnorm(length(unique(g_df_$value)))) 
 g_df_2 <- merge(g_df_, xy_s, by = "value")
 } else if(trophic=="TRUE") {
   # require NetIndices
  if(!require(NetIndices)) stop("must first install 'NetIndices' package.")
 # data preparation from adjacency matrix
 temp <- data.frame(expand.grid(dimnames(g[-trophinames, -trophinames]))[1:2], 
   as.vector(as.matrix(g[-trophinames, -trophinames])))
 temp <- temp[(temp[, 3] > 0) & !is.na(temp[, 3]), ]
 temp <- temp[sort.list(temp[, 1]), ]
 g_df <- data.frame(rows = temp[, 1], cols = temp[, 2], freqint = temp[, 3])
 
 g_df$id <- 1:length(g_df[,1])
 g_df <- data.frame(id=g_df[,4], rows=g_df[,1], 
      cols=g_df[,2], freqint=g_df[,3])
 g_df_ <- melt(g_df, id=c(1,4))
 
 xy_s <- data.frame(value = unique(g_df_$value), 
  x = rnorm(length(unique(g_df_$value))), 
  y = TrophInd(g, Import=import, Export=export)[,1])
 g_df_2 <- merge(g_df_, xy_s, by = "value") 
 }
 # plotting
 p <- ggplot(g_df_2, aes(x, y)) +
  geom_point(size = 5) +
  geom_line(aes(size = freqint, group = id)) +
  geom_text(size = 3, hjust = 1.5, aes(label = value)) +
  theme_bw() + 
  opts(panel.grid.major=theme_blank(), 
   panel.grid.minor=theme_blank(), 
   axis.text.x=theme_blank(),
   axis.text.y=theme_blank(),
   axis.title.x=theme_blank(),
   axis.title.y=theme_blank(),
   axis.ticks=theme_blank(),
   panel.border=theme_blank(),
   legend.position="none")
 
 p # return graph
} else if(method=="igraph") {
  if(class(g)!="igraph") stop("object must be of class 'igraph.'")
 # data preparation from igraph object
 g_ <- get.edgelist(g)
 g_df <- as.data.frame(g_)
 g_df$id <- 1:length(g_df[,1])
 g_df <- melt(g_df, id=3)
 xy_s <- data.frame(value = unique(g_df$value), 
  x = vplace(length(unique(g_df$value))), 
  y = vplace(length(unique(g_df$value))))
 g_df2 <- merge(g_df, xy_s, by = "value") 
 
 # plotting
 p <- ggplot(g_df2, aes(x, y)) +
  geom_point(size = 2) +
  geom_line(size = 0.3, aes(group = id, linetype = id)) +
  geom_text(size = 3, hjust = 1.5, aes(label = value)) +
  theme_bw() + 
  opts(panel.grid.major=theme_blank(), 
   panel.grid.minor=theme_blank(), 
   axis.text.x=theme_blank(),
   axis.text.y=theme_blank(),
   axis.title.x=theme_blank(),
   axis.title.y=theme_blank(),
   axis.ticks=theme_blank(),
   panel.border=theme_blank(),
   legend.position="none")
 
 p # return graph
} else 
 stop(paste("do not recognize method = \"",method,"\"; 
  methods are \"df\" and \"igraph\"",sep=""))
}

############### Eg
data(Takapoto)
gggraph(Takapoto, vplace = rnorm, method = "df", trophic = "TRUE", trophinames = c(8:10),
import = "CO2", export = c("CO2", "Sedimentation", "Grazing"))


plants <- round(rlnorm(n=5, meanlog=2, sdlog=1))
animals <- round(rlnorm(n=5, meanlog=2, sdlog=1))
plants <- plants*(100/sum(plants))
animals <- animals*(100/sum(animals))
z <- r2dtable(1,animals,plants)  # if you get errors on this step just rerun again until no error
z <- as.data.frame(z[[1]])
rownames(z) <- c("a","b","c","d","e")
gggraph(z, vplace = rnorm, method = "df", trophic = "FALSE")
 
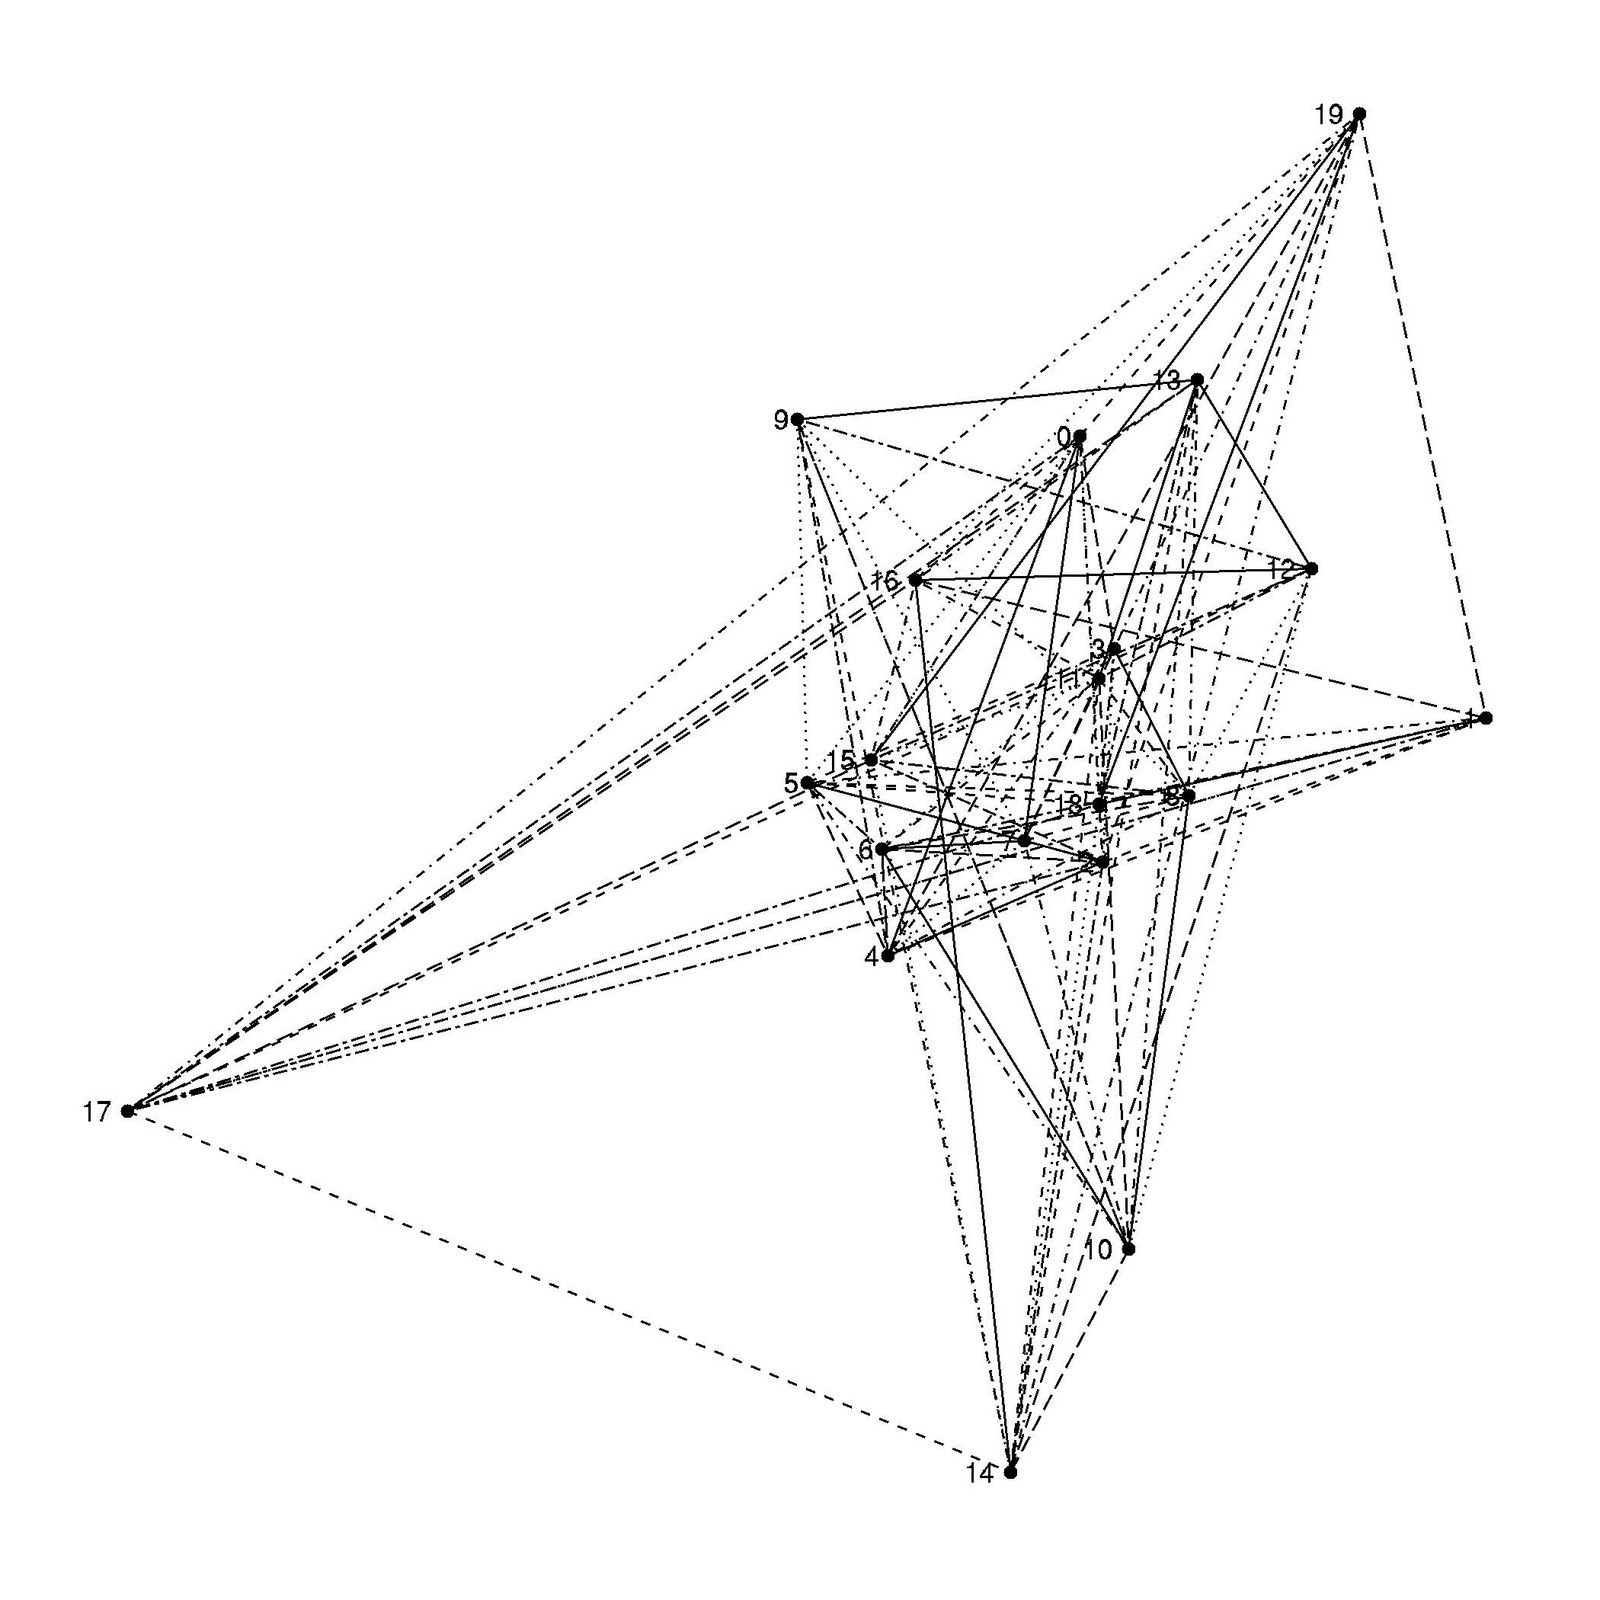
g <- grg.game(20, 0.45, torus=FALSE)
gggraph(g, vplace = rnorm, method = "igraph", trophic = "FALSE")


Created by Pretty R at inside-R.org

Thursday, March 17, 2011

basic ggplot2 network graphs

I have been looking around on the web and have not found anything yet related to using ggplot2 for making graphs/networks. I put together a few functions to make very simple graphs. The bipartite function especially is not ideal, as of course we only want to allow connections between unlike nodes, not all nodes. These functions do not, obviously, take full advantage of the power of ggplot2, but it’s a start.


# ggplot network graphics functions
# g = an igraph graph object, any igraph graph object
# vplace = type of vertex placement assignment, one of rnorm, runif, etc.
 
gggraph <- function(g, vplace = rnorm) {
 
 require(ggplot2)
 
 g_ <- get.edgelist(g)
 g_df <- as.data.frame(g_)
 g_df$id <- 1:length(g_df[,1])
 g_df <- melt(g_df, id=3)
 xy_s <- data.frame(value = unique(g_df$value), 
  x = vplace(length(unique(g_df$value))), 
  y = vplace(length(unique(g_df$value))))
 g_df2 <- merge(g_df, xy_s, by = "value") 
 
 p <- ggplot(g_df2, aes(x, y)) +
  geom_point() +
  geom_line(size = 0.3, aes(group = id, linetype = id)) +
  geom_text(size = 3, hjust = 1.5, aes(label = value)) +
  theme_bw() + 
  opts(panel.grid.major=theme_blank(), 
   panel.grid.minor=theme_blank(), 
   axis.text.x=theme_blank(),
   axis.text.y=theme_blank(),
   axis.title.x=theme_blank(),
   axis.title.y=theme_blank(),
   axis.ticks=theme_blank(),
   panel.border=theme_blank(),
   legend.position="none")
 
 p
 
}
 
ggbigraph <- function(g) {
 
 require(ggplot2) 
 
 g_ <- get.edgelist(g)
 g_df <- as.data.frame(g_)
 g_df$id <- 1:length(g_df[,1])
 g_df <- melt(g_df, id=3)
 xy_s <- data.frame(value = unique(g_df$value), 
  x = c(rep(2, length(unique(g_df$value))/2), rep(4, length(unique(g_df$value))/2)),
  y = rep(seq(1, length(unique(g_df$value))/2, 1), 2))
 g_df2 <- merge(g_df, xy_s, by = "value") 
 
 p <- ggplot(g_df2, aes(x, y)) +
  geom_point() +
  geom_line(size = 0.3, aes(group = id, linetype = id)) +
  geom_text(size = 3, hjust = 1.5, aes(label = value)) +
  theme_bw() + 
  opts(panel.grid.major=theme_blank(), 
   panel.grid.minor=theme_blank(), 
   axis.text.x=theme_blank(),
   axis.text.y=theme_blank(),
   axis.title.x=theme_blank(),
   axis.title.y=theme_blank(),
   axis.ticks=theme_blank(),
   panel.border=theme_blank(),
   legend.position="none")
 
 p
 
}
 
Created by Pretty R at inside-R.org


g <- erdos.renyi.game(20, 5, type="gnm")
gggraph(g, rnorm)

 
g <- barabasi.game(20)
gggraph(g, rnorm)


g <- grg.game(20, 0.45, torus=FALSE)
gggraph(g, rnorm)

 
g <- growing.random.game(20, citation=FALSE)
gggraph(g, rnorm)

 
g <- watts.strogatz.game(1, 20, 5, 0.05)
gggraph(g, rnorm)


# A bipartite graphs

g <- grg.game(20, 0.45, torus=FALSE)
ggbigraph(g)