Changes in version 2:
-You have one of three options: use an igraph object, a matrix, or a dataframe (matrices will be converted to data frames within the function)
-If you have data on food webs similar to that provided in the Takapoto dataset provided in the NetIndices package, you can set trophic = "TRUE", and gggraph will use the function TrophInd to assign trophic levels (the y axis value) to each vertex/node. You have to provide additional information along with this option such as what the imports and exports are, see NetIndices documentation.
-I added some simple error checking.
-if using method="df" and trophic="FALSE", x axis placement of vertices is now done using the function degreex (see inside the fxn), which sorts vertices according to their degree (so the least connected species are on the left of the graph; note that species with the same degree are not stacked on the y-axis because e.g., two vertices of degree=5 would get x=3 then x=4).
######### ggraph version 2
require(bipartite)
require(igraph)
require(ggplot2)
require(NetIndices)

# gggraph, version 2
# g = an igraph graph object, a matrix, or data frame
# vplace = type of vertex placement assignment, one of rnorm, runif, etc.
# method = one of 'df' for data frame, "mat' for matrix or "igraph" for an igraph graph object
# trophic = TRUE or FALSE for using Netindices function TrophInd to determine trophic level (y value in graph)
# trophinames = columns in matrix or dataframe to use for calculating trophic level
# import = named or refereced by col# columns of matrix or dataframe to use for import argument of TrophInd
# export = named or refereced by col# columns of matrix or dataframe to use for export argument of TrophInd
# dead = named or refereced by col# columns of matrix or dataframe to use for dead argument of TrophInd

gggraph <- function(g, vplace = rnorm, method, trophic = "FALSE",
     trophinames, import, export)
{
degreex  <- function(x) {
  degreecol <- apply(x, 2, function(y) length(y[y>0]))
  degreerow <- apply(x, 1, function(y) length(y[y>0]))
  degrees <- sort(c(degreecol, degreerow))
  df <- data.frame(degrees, x = seq(1, length(degrees), 1))
  df$value <- rownames(df)
  df
 }
  # require igraph
 if(!require(igraph)) stop("must first install 'igraph' package.")
   # require ggplot2
 if(!require(ggplot2)) stop("must first install 'ggplot2' package.")

if(method=="df"){
  if(class(g)=="matrix"){ g <- as.data.frame(g) }
  if(class(g)!="data.frame") stop("object must be of class 'data.frame.'")
if(trophic=="FALSE"){
 # data preparation from adjacency matrix
 temp <- data.frame(expand.grid(dimnames(g))[1:2], as.vector(as.matrix(g)))
 temp <- temp[(temp[, 3] > 0) & !is.na(temp[, 3]), ]
 temp <- temp[sort.list(temp[, 1]), ]
 g_df <- data.frame(rows = temp[, 1], cols = temp[, 2], freqint = temp[, 3])

 g_df$id <- 1:length(g_df[,1])
 g_df <- data.frame(id=g_df[,4], rows=g_df[,1], cols=g_df[,2], freqint=g_df[,3])
 g_df_ <- melt(g_df, id=c(1,4))

 xy_s <- data.frame(degreex(g), y = rnorm(length(unique(g_df_$value))))
 g_df_2 <- merge(g_df_, xy_s, by = "value")
 } else if(trophic=="TRUE") {
   # require NetIndices
  if(!require(NetIndices)) stop("must first install 'NetIndices' package.")
 # data preparation from adjacency matrix
 temp <- data.frame(expand.grid(dimnames(g[-trophinames, -trophinames]))[1:2],
   as.vector(as.matrix(g[-trophinames, -trophinames])))
 temp <- temp[(temp[, 3] > 0) & !is.na(temp[, 3]), ]
 temp <- temp[sort.list(temp[, 1]), ]
 g_df <- data.frame(rows = temp[, 1], cols = temp[, 2], freqint = temp[, 3])

 g_df$id <- 1:length(g_df[,1])
 g_df <- data.frame(id=g_df[,4], rows=g_df[,1],
      cols=g_df[,2], freqint=g_df[,3])
 g_df_ <- melt(g_df, id=c(1,4))

 xy_s <- data.frame(value = unique(g_df_$value),
  x = rnorm(length(unique(g_df_$value))),
  y = TrophInd(g, Import=import, Export=export)[,1])
 g_df_2 <- merge(g_df_, xy_s, by = "value")
 }
 # plotting
 p <- ggplot(g_df_2, aes(x, y)) +
  geom_point(size = 5) +
  geom_line(aes(size = freqint, group = id)) +
  geom_text(size = 3, hjust = 1.5, aes(label = value)) +
  theme_bw() +
  opts(panel.grid.major=theme_blank(),
   panel.grid.minor=theme_blank(),
   axis.text.x=theme_blank(),
   axis.text.y=theme_blank(),
   axis.title.x=theme_blank(),
   axis.title.y=theme_blank(),
   axis.ticks=theme_blank(),
   panel.border=theme_blank(),
   legend.position="none")

 p # return graph
} else if(method=="igraph") {
  if(class(g)!="igraph") stop("object must be of class 'igraph.'")
 # data preparation from igraph object
 g_ <- get.edgelist(g)
 g_df <- as.data.frame(g_)
 g_df$id <- 1:length(g_df[,1])
 g_df <- melt(g_df, id=3)
 xy_s <- data.frame(value = unique(g_df$value),
  x = vplace(length(unique(g_df$value))),
  y = vplace(length(unique(g_df$value))))
 g_df2 <- merge(g_df, xy_s, by = "value")

 # plotting
 p <- ggplot(g_df2, aes(x, y)) +
  geom_point(size = 2) +
  geom_line(size = 0.3, aes(group = id, linetype = id)) +
  geom_text(size = 3, hjust = 1.5, aes(label = value)) +
  theme_bw() +
  opts(panel.grid.major=theme_blank(),
   panel.grid.minor=theme_blank(),
   axis.text.x=theme_blank(),
   axis.text.y=theme_blank(),
   axis.title.x=theme_blank(),
   axis.title.y=theme_blank(),
   axis.ticks=theme_blank(),
   panel.border=theme_blank(),
   legend.position="none")

 p # return graph
} else
 stop(paste("do not recognize method = \"",method,"\";
  methods are \"df\" and \"igraph\"",sep=""))
}
############### Eg
data(Takapoto)
gggraph(Takapoto, vplace = rnorm, method = "df", trophic = "TRUE", trophinames = c(8:10),
import = "CO2", export = c("CO2", "Sedimentation", "Grazing"))

plants <- round(rlnorm(n=5, meanlog=2, sdlog=1))
animals <- round(rlnorm(n=5, meanlog=2, sdlog=1))
plants <- plants*(100/sum(plants))
animals <- animals*(100/sum(animals))
z <- r2dtable(1,animals,plants)  # if you get errors on this step just rerun again until no error
z <- as.data.frame(z[[1]])
rownames(z) <- c("a","b","c","d","e")
gggraph(z, vplace = rnorm, method = "df", trophic = "FALSE")
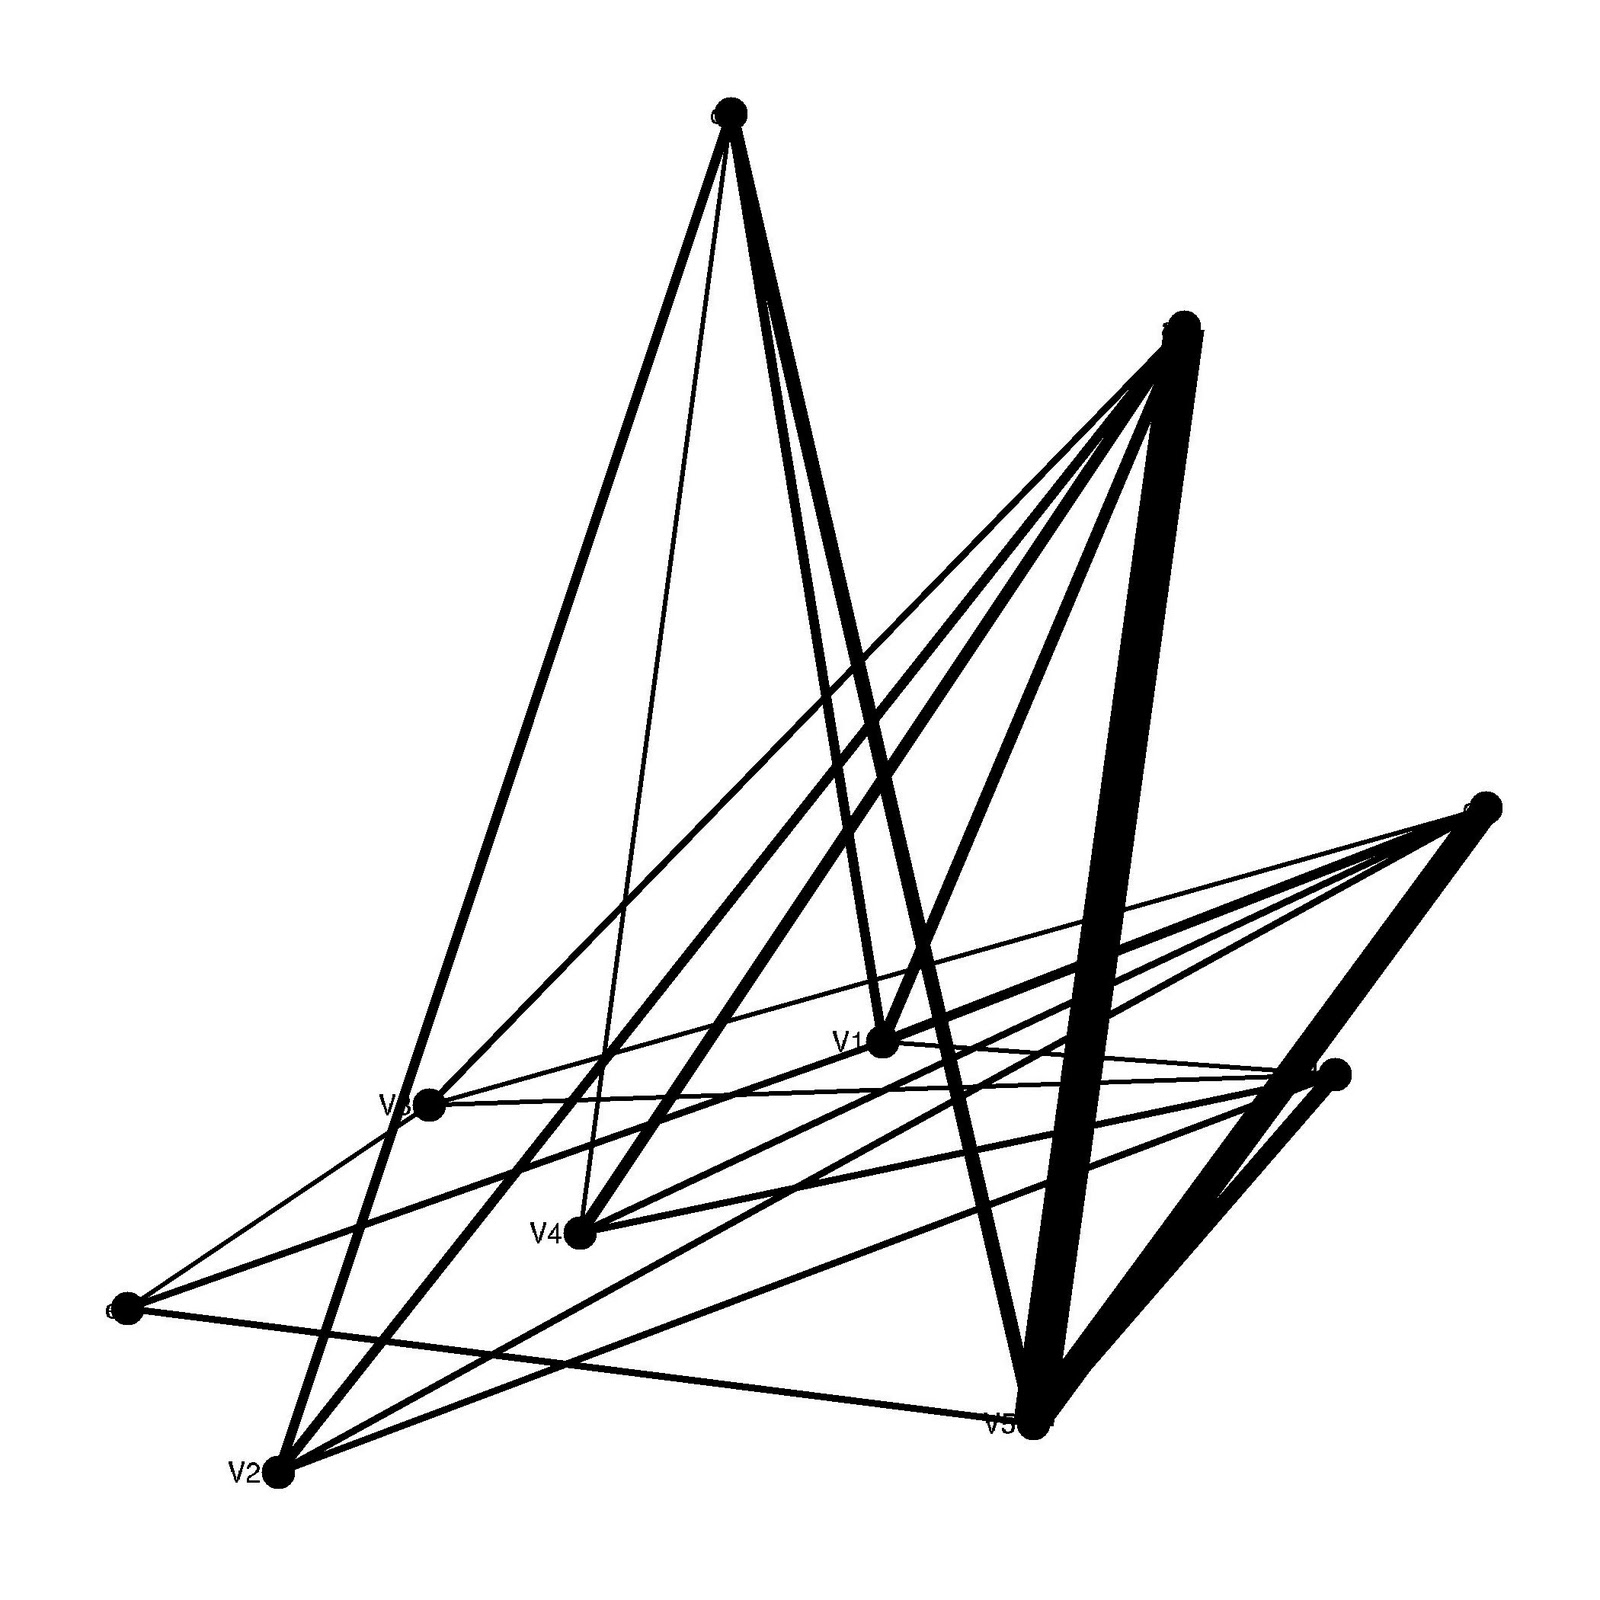
g <- grg.game(20, 0.45, torus=FALSE)
gggraph(g, vplace = rnorm, method = "igraph", trophic = "FALSE")

Created by Pretty R at inside-R.org
This? Is awesome.
ReplyDeleteOne comment - trophinames seems to be the columns/rows you DON'T want to include rather than vice-versa. I'm also trying to figure out a nice way of making line widths thinner when you just have a normal adjacency matrix, but, AWESOME overall.
ReplyDeleteThanks Jarrett, although I forgot to cite you for giving me the Netindices idea. I don't do food web stuff myself, so I hope folks can give me ideas on how to improve the code (other than creating an actual ggplot2 geom some day, and making the code more flexible).
ReplyDeleteRight, I'll fix the description of trophinames.
Yeah, I'm still working on incorporating 'toggles' for ggplot options. You can change the function manually by deleting 'size = freqint' for now