Download USDA data here. The formatted file I used below is here (in excel format, although I read into R as csv file). The census data is read from url as below.
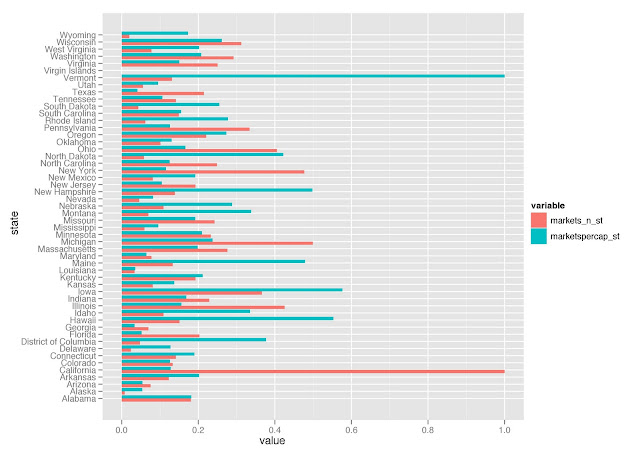
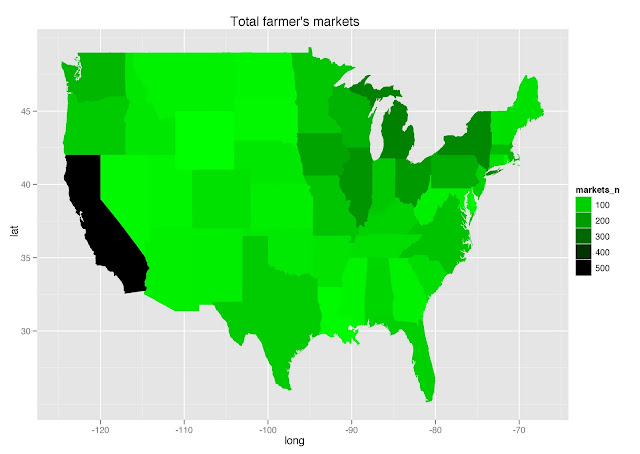
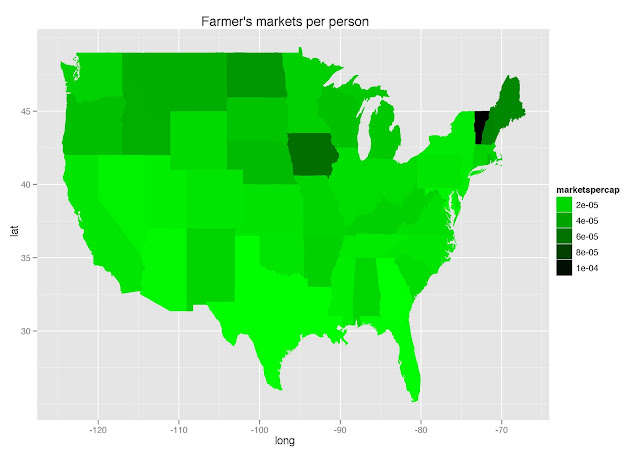
California has a ton of absolute number of farmer's markets, but Vermont takes the cake by far with number of markets per capita. Iowa comes in a distant second behind Vermont in markets per capita.
The code:
######## Farmer's Markets #############
setwd("/Mac/R_stuff/Blog_etc/USDAFarmersMarkets") # Set to your working directory, this is where you want to call files from and write files to
install.packages(c("ggplot2", "RCurl"))  # install all packags required below
require(ggplot2) # plyr is libraried along with ggplot2, as ggplot2 uses plyr (as well as package reshape) functions

# read market data
markets <- read.csv("farmmarkets.csv")
markets$state <- as.factor(gsub("Wyoming ", "Wyoming", markets$LocAddState)) # there was a typo for Wyoming
markets <- na.omit(markets)
str(markets)

# read population census data
popcen <- read.csv("http://www.census.gov/popest/national/files/NST_EST2009_ALLDATA.csv")
popcen <- popcen[,c(4,5,6,17)]
str(popcen)

# summarize
markets_ <- ddply(markets, .(state), summarise,
 markets_n = length(LocAddState)
)

markets_pop_ <- merge(markets_, popcen[,-1], by.x = "state", by.y = "NAME") # merge two data sets
markets_pop_$marketspercap <- markets_pop_$markets_n/markets_pop_$POPESTIMATE2009 # create column of markets per capita
markets_pop_$markets_n_st <- markets_pop_$markets_n/max(markets_pop_$markets_n)
markets_pop_$marketspercap_st <- markets_pop_$marketspercap/max(markets_pop_$marketspercap)

# plot
ggplot(melt(markets_pop_[,-c(2:5)]), aes(x = state, y = value, fill = variable)) +
 geom_bar(position = "dodge") +
 coord_flip()
ggsave("fmarkets_barplot.jpeg")
Note: the x-axis here is standardized value of number of markets (markets_n_st) and number of markets per capita (marketspercap_st).

# maps
try_require("maps")
states <- map_data("state")
markets_pop_$statelow <- tolower(markets_pop_$state)
survey_sum_map <- merge(states, markets_pop_, by.x = "region", by.y = "statelow")
survey_sum_map <- survey_sum_map[order(survey_sum_map$order), ]
str(survey_sum_map)

qplot(long, lat, data = survey_sum_map, group = group, fill = markets_n, geom = "polygon", main = "Total farmer's markets") +
 scale_fill_gradient(low="green", high="black")
ggsave("fmarkets_map_green.jpeg")

qplot(long, lat, data = survey_sum_map, group = group, fill = marketspercap, geom = "polygon", main = "Farmer's markets per person") +
 scale_fill_gradient(low="green", high="black")

ggsave("fmarkerspercap_map_green.jpeg")

No comments:
Post a Comment